Benchmark: protein-protein interfaces
This page describes how well WHISCY predicts protein-protein interfaces, based on a benchmark using the complexes of Docking Benchmark 5 without antibodies. It uses the homolog search of WHISCY 1.4.0 (ColabFold MMseqs2), run in October 2026.
Dataset
- Complexes: the 187 complexes of Docking Benchmark 5 (Vreven et al., J. Mol. Biol. 2015, doi:10.1016/j.jmb.2015.07.016) excluding antibody, antibody fragment or nanobody, from the HADDOCK-ready version haddocking/BM5-clean.
- Structures: both partners of each complex, from the bound structures: 374 chains of 28 to 2119 residues (median 182.5). 52 partners made of several chains are merged into one chain in BM5-clean; the main results are for the 322 single-chain partners, as users would submit them.
- Categories: enzyme-inhibitor (EI, 44 complexes), enzyme-substrate (ES, 17), enzyme with a regulatory or accessory chain (ER, 26), G-protein (OG, 23), receptor (OR, 22) and other (OX, 50).
- True interface: the residues with a heavy atom within 5 Å of a heavy atom of the partner. Only surface residues count, since only those are scored. The median interface has 19 surface residues; on average 13% of the surface residues are interface residues.
Protocol
whiscy_setupon each chain, without an alignment: WHISCY searches for homologs (ColabFold MMseqs2, at most 90% identity, at least 50% coverage, up to 250 homologs; EBI BLAST below 10).- The default protocol of the web server:
whiscyon the surface and on the low-accessible residues, interface propensities (whiscy_consadjust) and surface smoothing (whiscy_parasmooth). - Precision: the share of predicted residues that are interface residues. Recall: the share of true interface residues that are predicted. Values are pooled over all chains, or averaged per chain (mean).
368 of the 374 chains got an alignment. The 6 without one are merged partners of 456 to 2119 residues, for which almost no homolog covers half of the merged sequence.
Interface prediction
Single-chain partners (322 chains), precision (P) and recall (R), pooled or mean per chain, and the chains with at least one residue selected:
| Selection | P pooled | R pooled | P mean | R mean | Chains |
|---|---|---|---|---|---|
| Top 10 | 0.39 | 0.20 | 0.39 | 0.21 | 322 / 322 |
| Top 20 | 0.34 | 0.34 | 0.34 | 0.36 | 322 / 322 |
| Top 20% | 0.27 | 0.37 | 0.32 | 0.36 | 322 / 322 |
| Score ≥ 0.18 | 0.35 | 0.17 | 0.41 | 0.17 | 282 / 322 |
A random pick has a precision of 0.14. For the merged multi-chain partners the top-10 precision is 0.22 (random 0.09).
By category (all chains, pooled precision / recall):
| Category | Chains | Top 10 | Top 20 | Score ≥ 0.18 |
|---|---|---|---|---|
| EI enzyme-inhibitor | 90 | 0.44 / 0.22 | 0.37 / 0.38 | 0.40 / 0.14 |
| ES enzyme-substrate | 34 | 0.39 / 0.23 | 0.33 / 0.39 | 0.19 / 0.28 |
| ER enzyme-regulatory | 51 | 0.40 / 0.18 | 0.35 / 0.31 | 0.37 / 0.21 |
| OG G-protein | 46 | 0.53 / 0.25 | 0.45 / 0.43 | 0.41 / 0.33 |
| OR receptor | 45 | 0.21 / 0.10 | 0.22 / 0.21 | 0.12 / 0.09 |
| OX other | 102 | 0.28 / 0.15 | 0.25 / 0.26 | 0.22 / 0.14 |
Top N and score cutoff
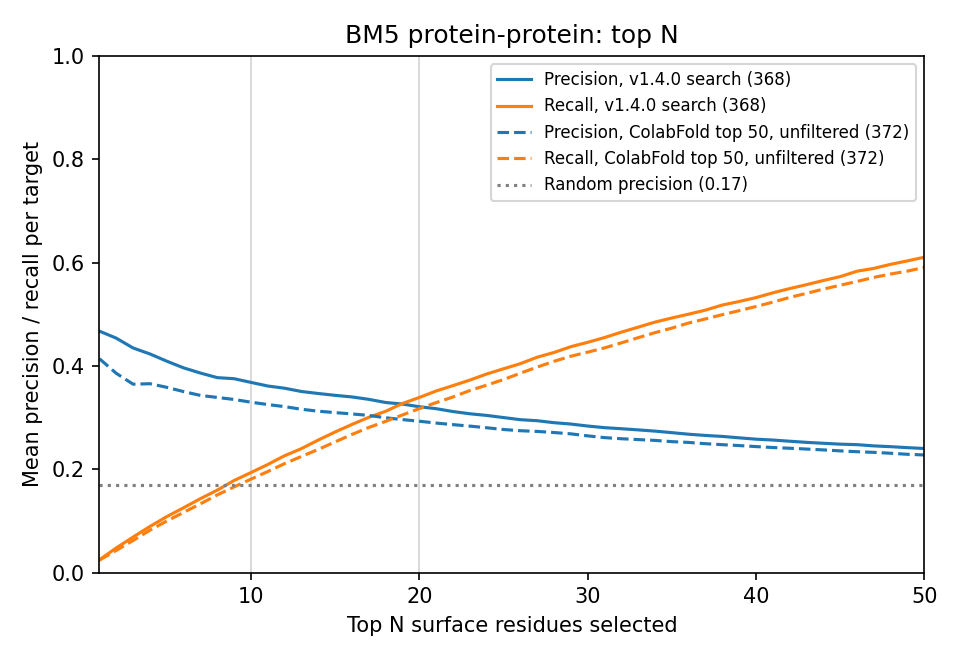
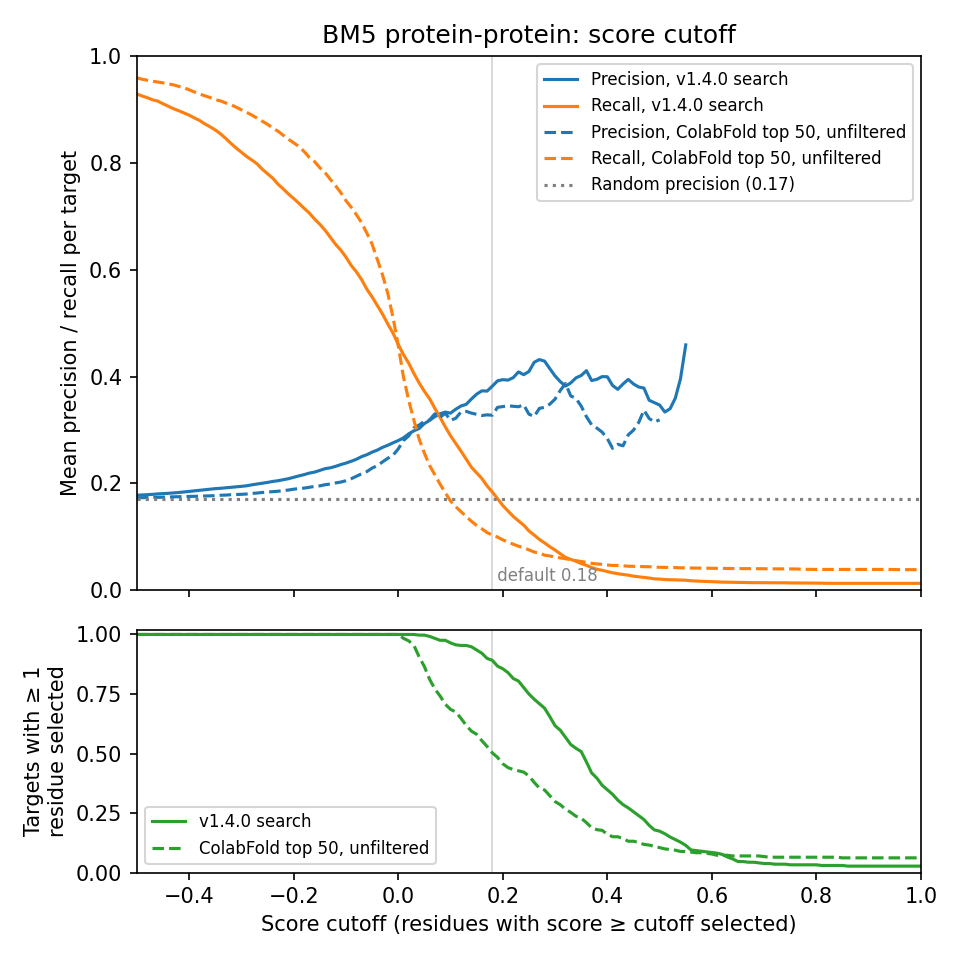
Mean precision and recall per chain (all 368 chains) for the top 1 to 50 residues and for score cutoffs from −0.5 to 1.0. The random precision per chain is 0.17.
| Top N | 1 | 2 | 5 | 10 | 20 | 30 | 50 |
|---|---|---|---|---|---|---|---|
| Precision | 0.47 | 0.45 | 0.41 | 0.37 | 0.32 | 0.28 | 0.24 |
| Recall | 0.02 | 0.05 | 0.11 | 0.19 | 0.34 | 0.45 | 0.61 |
| Score cutoff | −0.2 | 0.0 | 0.1 | 0.18 | 0.3 | 0.4 |
|---|---|---|---|---|---|---|
| Precision | 0.21 | 0.28 | 0.33 | 0.38 | 0.40 | 0.40 |
| Recall | 0.73 | 0.46 | 0.29 | 0.18 | 0.08 | 0.04 |
| Chains with ≥ 1 selected | 100% | 100% | 96% | 89% | 62% | 35% |
ROC
Mean ROC curve per chain, over all surface residues ranked by score. The markers are the top 10 and the 0.18 cutoff.
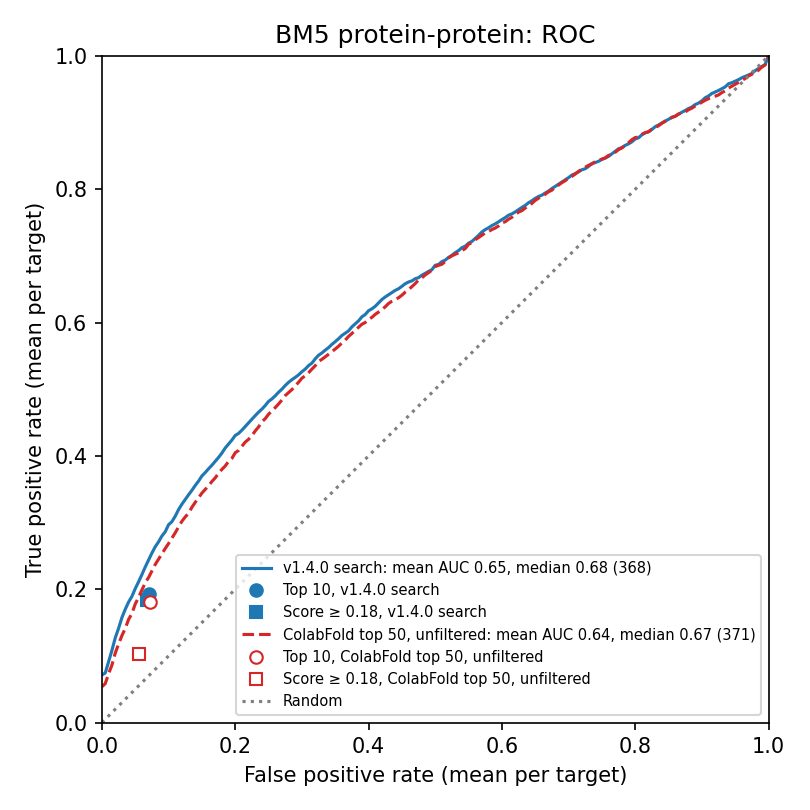
Mean AUC: 0.65 over all chains (median 0.68), 0.66 for the single-chain partners. By category: EI 0.66, ES 0.70, ER 0.68, OG 0.76, OR 0.54, OX 0.60.
HADDOCK restraints
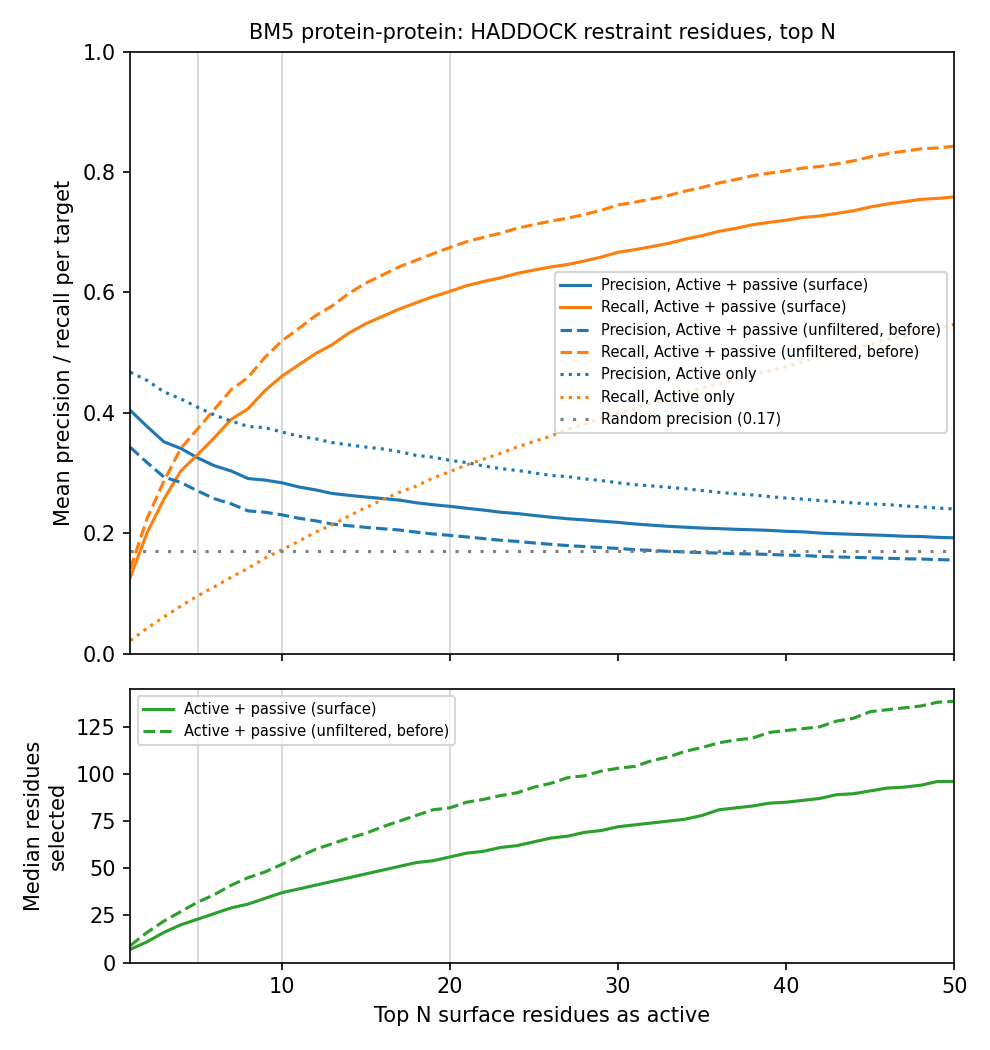
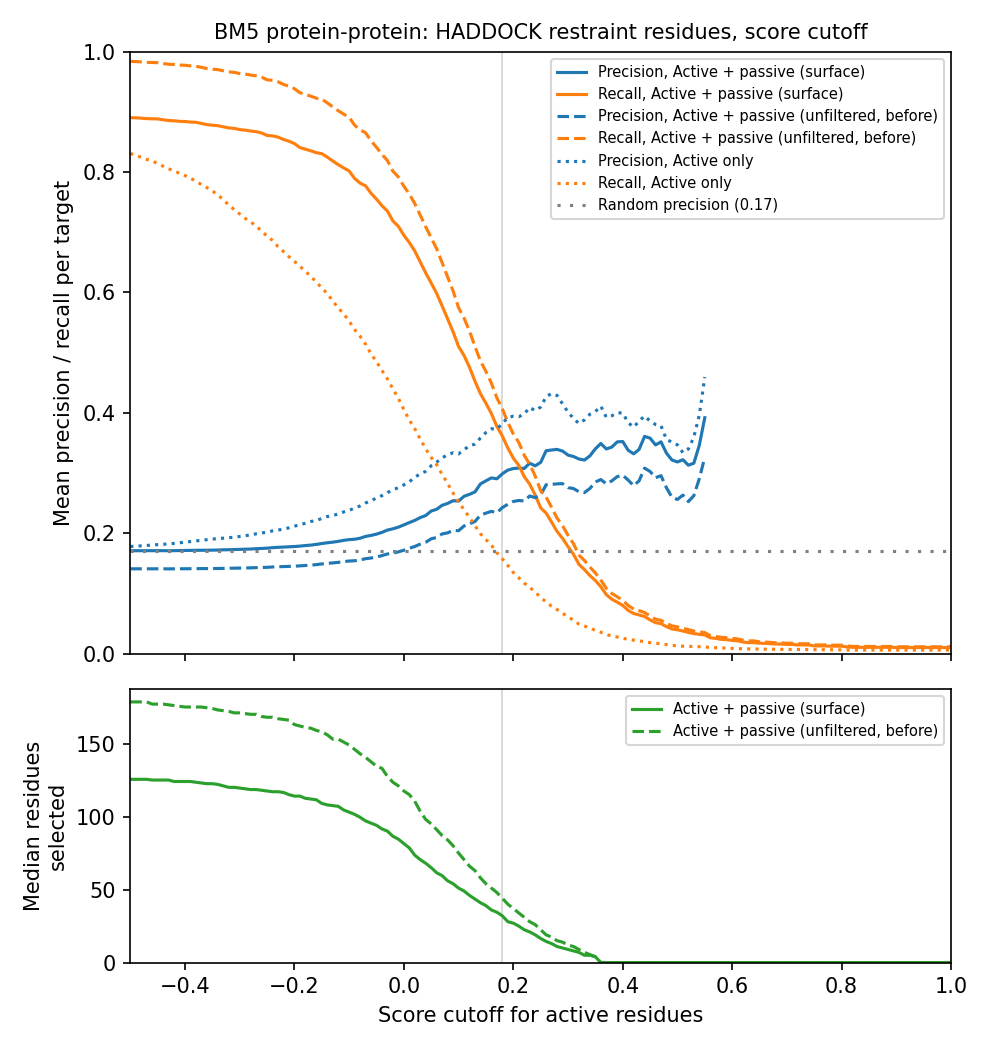
whiscy_haddock turns the prediction into active residues and passive
residues for use in HADDOCK. Passive residues are defined as the surface
residues with an atom within 6.5 Å of the Cα of an active residue.
Here the active residues are the top N residues or those
above a score cutoff. Precision and recall of the combined list are means
per chain against the full interface, buried residues included, so recall
cannot exceed 0.88 with surface passive residues. The lower panels show the
median number of residues in the list.
| Active residues | Median list size | Precision | Recall | Chains |
|---|---|---|---|---|
| Top 1 | 7 | 0.40 | 0.13 | 368 / 368 |
| Top 5 | 23 | 0.33 | 0.33 | 368 / 368 |
| Top 10 | 37 | 0.28 | 0.46 | 368 / 368 |
| Top 20 | 56 | 0.24 | 0.60 | 368 / 368 |
| Score ≥ 0.1 | 51 | 0.25 | 0.51 | 355 / 368 |
| Score ≥ 0.18 | 32 | 0.30 | 0.36 | 328 / 368 |
| Score ≥ 0.3 | 9 | 0.33 | 0.18 | 227 / 368 |
Findings
- Ranking works: for single-chain partners, the top 10 residues have a precision of 0.39, against 0.14 for a random pick. The best-scored 1 to 5 residues are the most precise (0.41–0.47).
- Results depend on the type of complex: G-proteins and enzyme-inhibitor complexes score best (top-10 precision 0.53 and 0.44), receptors and other complexes worst (0.21 and 0.28). For receptors the 0.18 cutoff is no better than random.
- Top 10 or score cutoff: per chain, the 0.18 cutoff (precision 0.38, recall 0.18) performs like the top 10 (0.37 and 0.19), but 11% of the chains get no active residue at 0.18, and the number of active residues varies from 0 to 55 per chain (median 7). As HADDOCK restraints, the top 10 gives a list of 37 residues (precision 0.28, recall 0.46) and restraints for every chain; the 0.18 cutoff gives 32 residues (0.30 and 0.36). WHISCY therefore gives both selections.
- Submit single chains: merged multi-chain partners are poorly predicted (top-10 precision 0.22), since each homolog covers only part of the merged sequence.